Interactive charts
Interactive charts that render inside your customers’ agent. Add one function to your MCP server and the chart comes from your query result.
npm install @bonnard/mcp-chartsWhy use Bonnard Charts?
An inference engine that picks the chart, axes, and formatting from your query result
Works with text-to-SQL or semantic layers.
You write no frontend code
One widget that works across all MCP apps. You don’t maintain per-host rendering code.
Interactive widgets, not static SVGs
Native to the client, with light and dark themes and number/date formatting inferred from your column types.
Visuals render cleanly in every MCP Apps client
 Claude
 ChatGPT
 Cursor
 Copilot
Easy MCP visuals for data
One function adds a charting tool to your MCP server. Pass a query callback and skip the frontend.
- import { addCharts } from "@bonnard/mcp-charts";
- addCharts(mcpServer, { // add a `visualize` tool and MCP app to your mcp
- runSql: (sql) => db.query(sql), // pass a query callback
- });
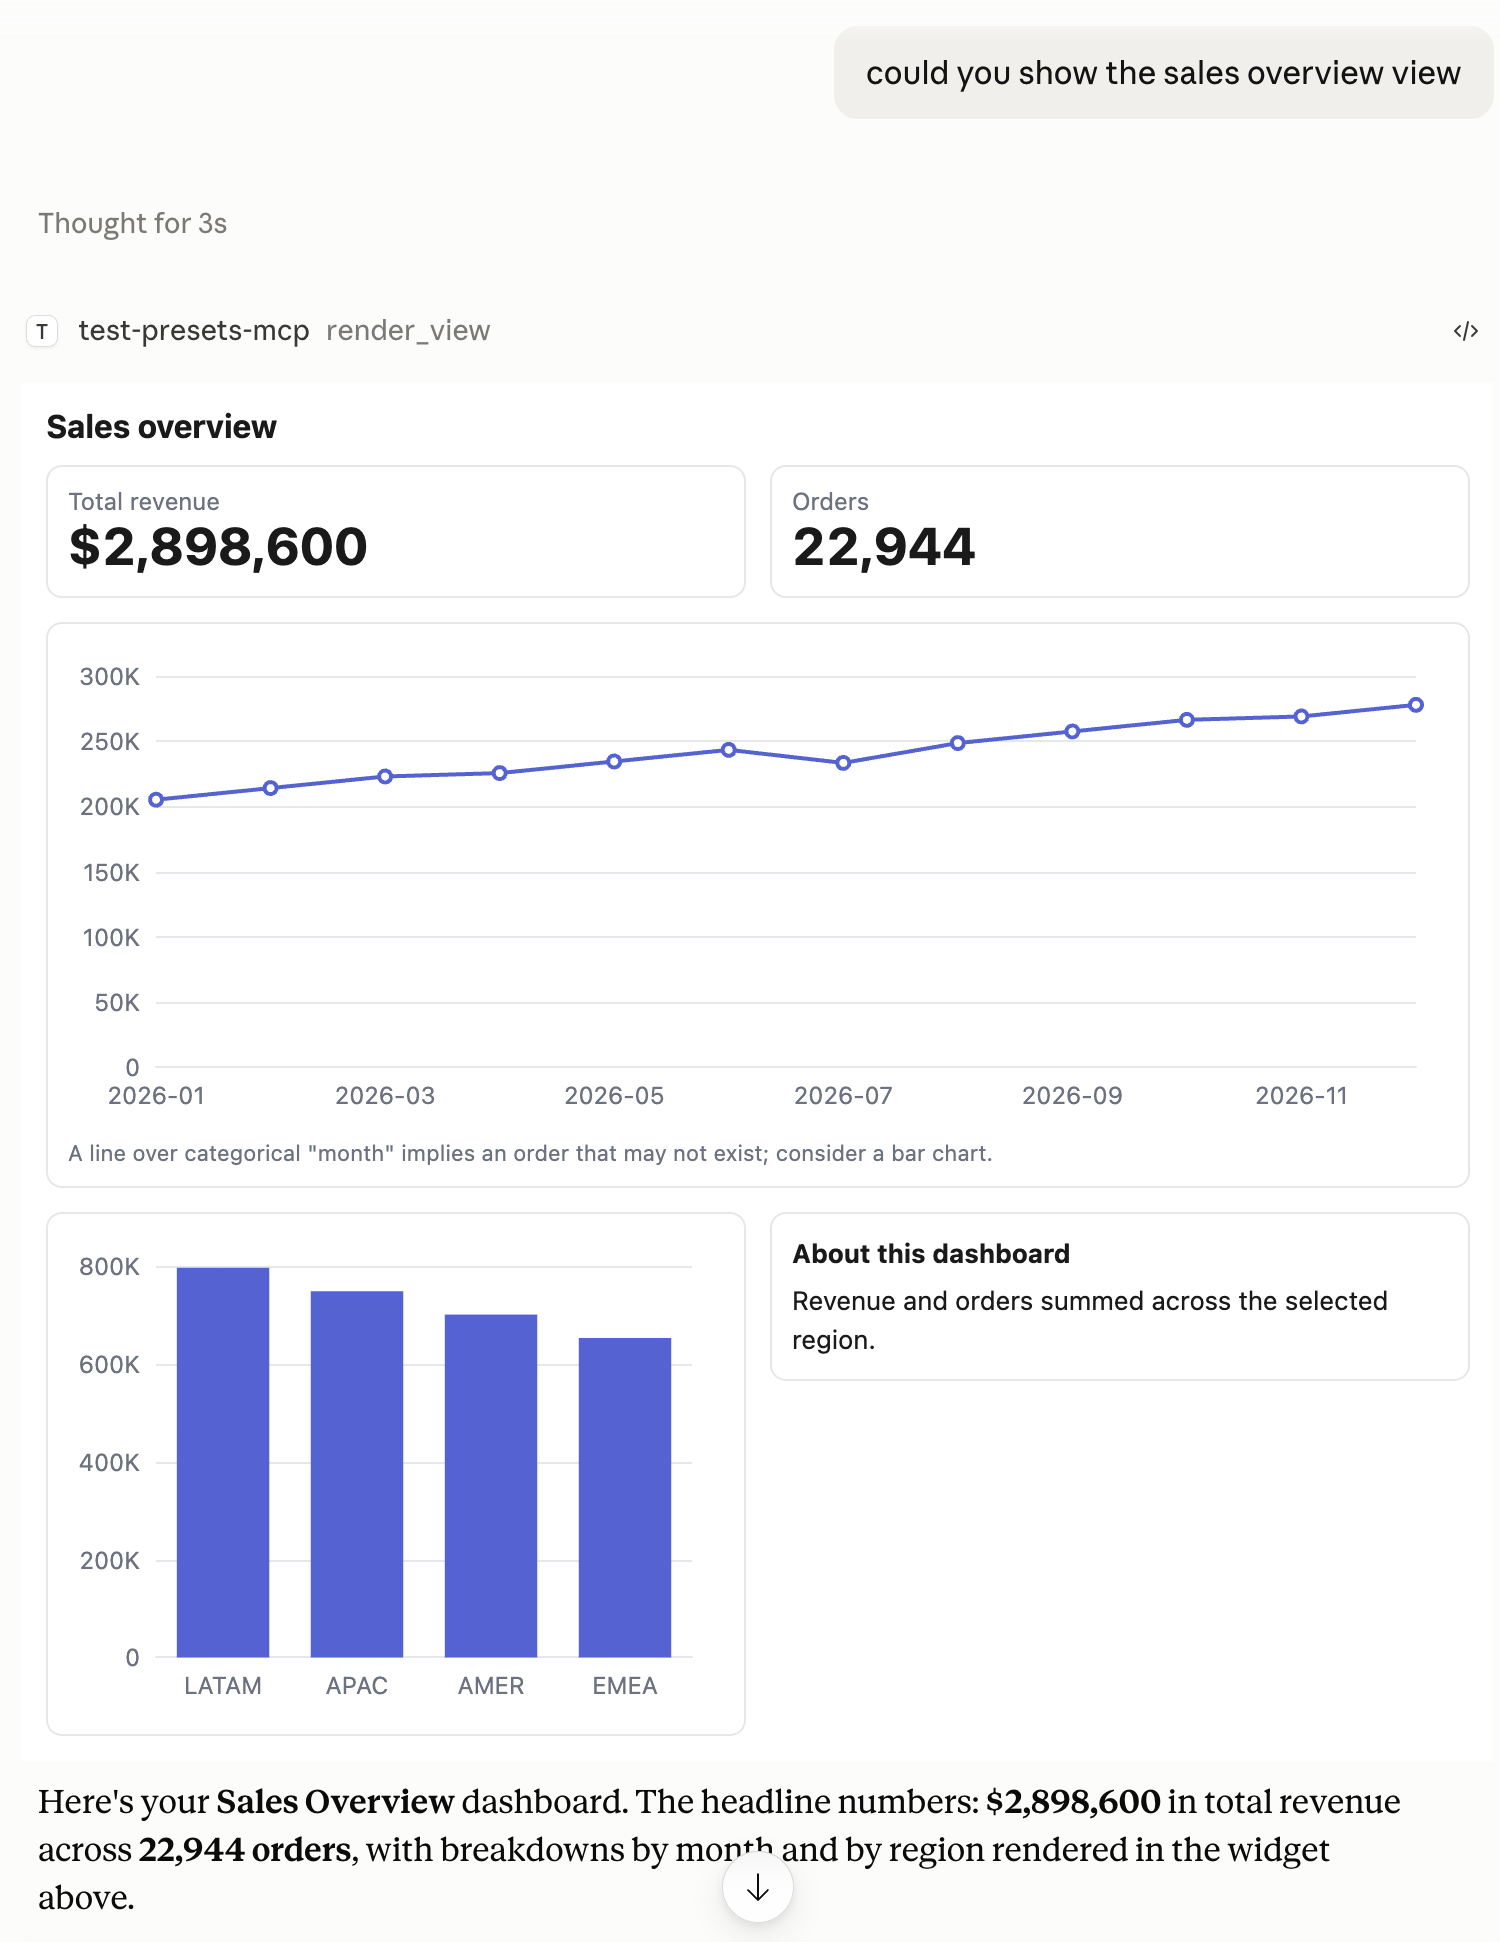
Create pre-built dashboards
Write preset views that can be called directly by agents. Define the view in code, register it, and agents can explore and render your views using our built-in view exploration and rendering tools.
- import { addViews, chartCell } from "@bonnard/mcp-charts";
- addViews(mcpServer, {
- views: [{
- id: "sales_overview", // agent picks it by name
- kind: "dashboard",
- render: () => ({
- items: [
- { type: "kpi", label: "Revenue", value: 336800, format: "currency" },
- chartCell(monthlyRows(), { chartType: "line", title: "Revenue by month" }),
- ],
- }),
- }],
- });
Built for the agent
An agent can only use a tool it can read. The visualize tool is shaped for how the model calls it, not just for the human looking at the chart.
Managed token context, not raw dumps
Compact text summaries and row sampling keep tool output small and readable.
Errors that guide the next action
Clear errors and feedback loops steer the agent toward the correct call.
Less hallucination surface
We push deterministic work out of the model and into the code.
Clear tool descriptions
The agent knows exactly how and when to call the tool.
Take control of your data presentation
It’s the most important part of your experience. Don’t hand it to the agent to improvise in artifacts or generated HTML.
 Bonnard Charts
Charts built for agents.
Render charts in any MCP Apps client, generated from real query data.
ClaudeChatGPTCursorCopilot